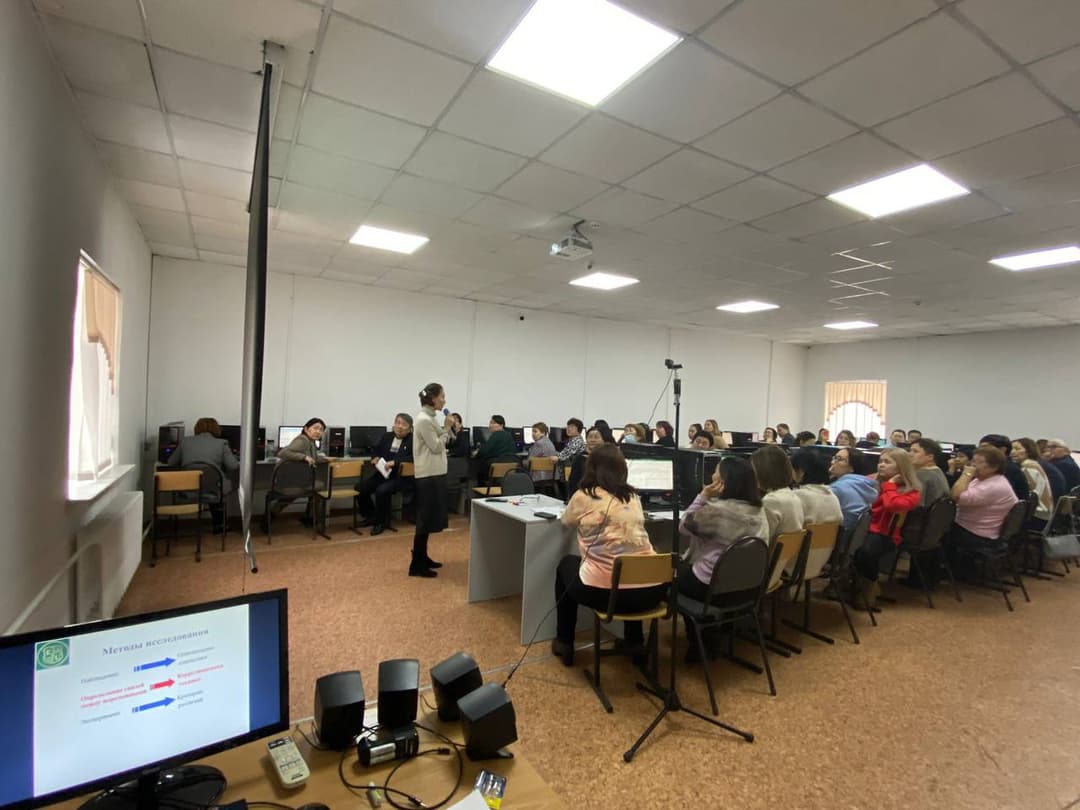
Associate Professor of the Department of Management, Lena Khuanyshovna, conducted a master class on the topic: "Research Methodology."
During the seminar, students were shown how to correctly apply the method of correlation analysis in practice using Microsoft Excel. This is a widely used statistical research method employed to determine the degree of dependence of one indicator on another.
The purpose of correlation analysis is to determine the existence of a relationship between various factors. That is, it is established that a decrease or increase in one indicator affects the change in another. If a relationship is identified, the correlation coefficient is determined.
Unlike regression analysis, this is the sole indicator that accounts for the given method of statistical survey. The correlation coefficient ranges from +1 to −1. In the case of positive correlation, an increase in one indicator contributes to an increase in another. Calculation of the correlation coefficient: using a specific example, the correlation coefficient was computed.